Description
In a group of two, we worked on a project for the master’s course “Information Retrieval and Text Mining”. This project retrieves information from the Sherlock Holmes stories by using a number of text mining techniques and validates their correctness with quality measures based on a kappa distance verified dataset after adding annotations with tagtog.
This text mining project concerned the analysis of all 60 Sherlock Holmes narratives. During the project, we preprocessed the stories, created a validation set for the Stanford coreNLP NER annotator by using tagtog on 100 data samples with 4 independent judges. The Kappa distance agreement for the entity type person reached 91.7% and for location 81.6%, thus enabling us to use the validation set. The coreNLP NER annotator was verified on the validation set and received a recall score of 80% for persons and 79% for locations thus allowing us to continue with this parser.
For the core text mining techniques, we firstly extracted vocabulary using lemmatization by story for the exploratory data analysis to introduce the reader to the publications. Next, we optimized the Stanford’s coreNLP parser for Sherlock Holmes stories by research about parser options and using custom rules sets to achieve higher quality. We further analyzed POS tags and named entities in different settings after normalizing character names using a combination of distance measures. Based on named entities another information retrieval technique was applied to retrieve a social network between characters based on the token distance of their names in all stories. Visualisations were generated using the desktop visualization tool Tableau and Gephi.
Finally, we learned that preprocessing and parsing for text mining projects take up a large part of the time. Particularly the constant iterations to improve their quality were challenging. Here we helped ourselves by applying software engineering to automate repetitive tasks and to create helper functions for common methods.
This project is on GitHub: https://github.com/arthurhaas/um_2021_text_mining
A few selected results
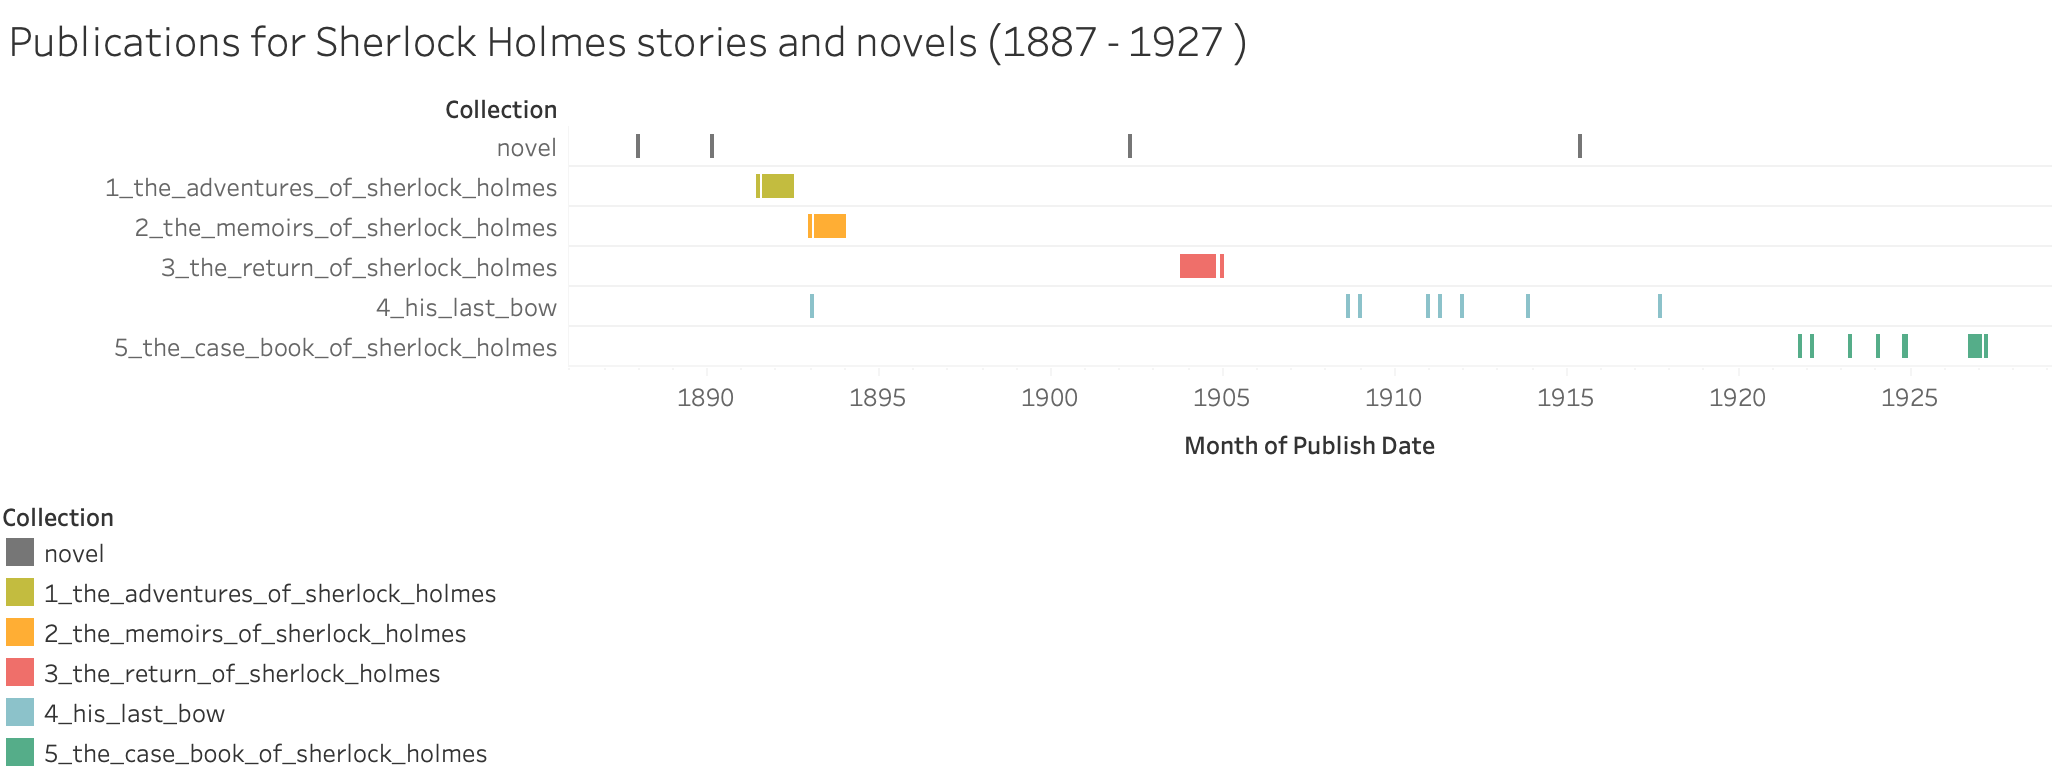
/1 A first exploratory data analysis is performed to introduce the reader to the Sherlock Holmes stories in the dataset. It shows all 56 stories and 4 novels of Sir Arthur Conan Doyle, in ascending order by publishing date and grouped by the collection. From this visualization, it can be seen, that Sir Doyle first wrote two novels before starting with the shorter stories. While the first three collections The Adventures of Sherlock Holmes, The Memoirs of Sherlock Holmes and The Return of Sherlock Holmes were written in a short period of time, his latter two collections His Last Bow and The Case Book of Sherlock Holmes were spread over several years. Most interestingly it is visible, that one story from January 1893, called The Adventure of the Cardboard Box was originally written while creating the second collection of stories, but later this story was assigned to the fourth collection.
Publications by year and month
/2
Another very interesting view on the dataset is the analysis by vocabulary size. It shows again all 56 stories and 4 novels in ascending order by publishing date. The bars indicate the vocabulary size after lemmatization with the color indicating the collection. The line shows the same vocabulary but cumulatively counted over the years. With the last story published in March 1927, Sir Doyle used a total of around 15,000 distinct words. It is not surprising that the stories contain a smaller vocabulary than the novels because these are shorter in general. Moreover, Sir Doyle was able to constantly increase his vocabulary, although it is visible, that the latter stories from the last collection (in green) seem to use a lower vocabulary size. Used Vocabulary by Conan Doyle over his works on Sherlock Holmes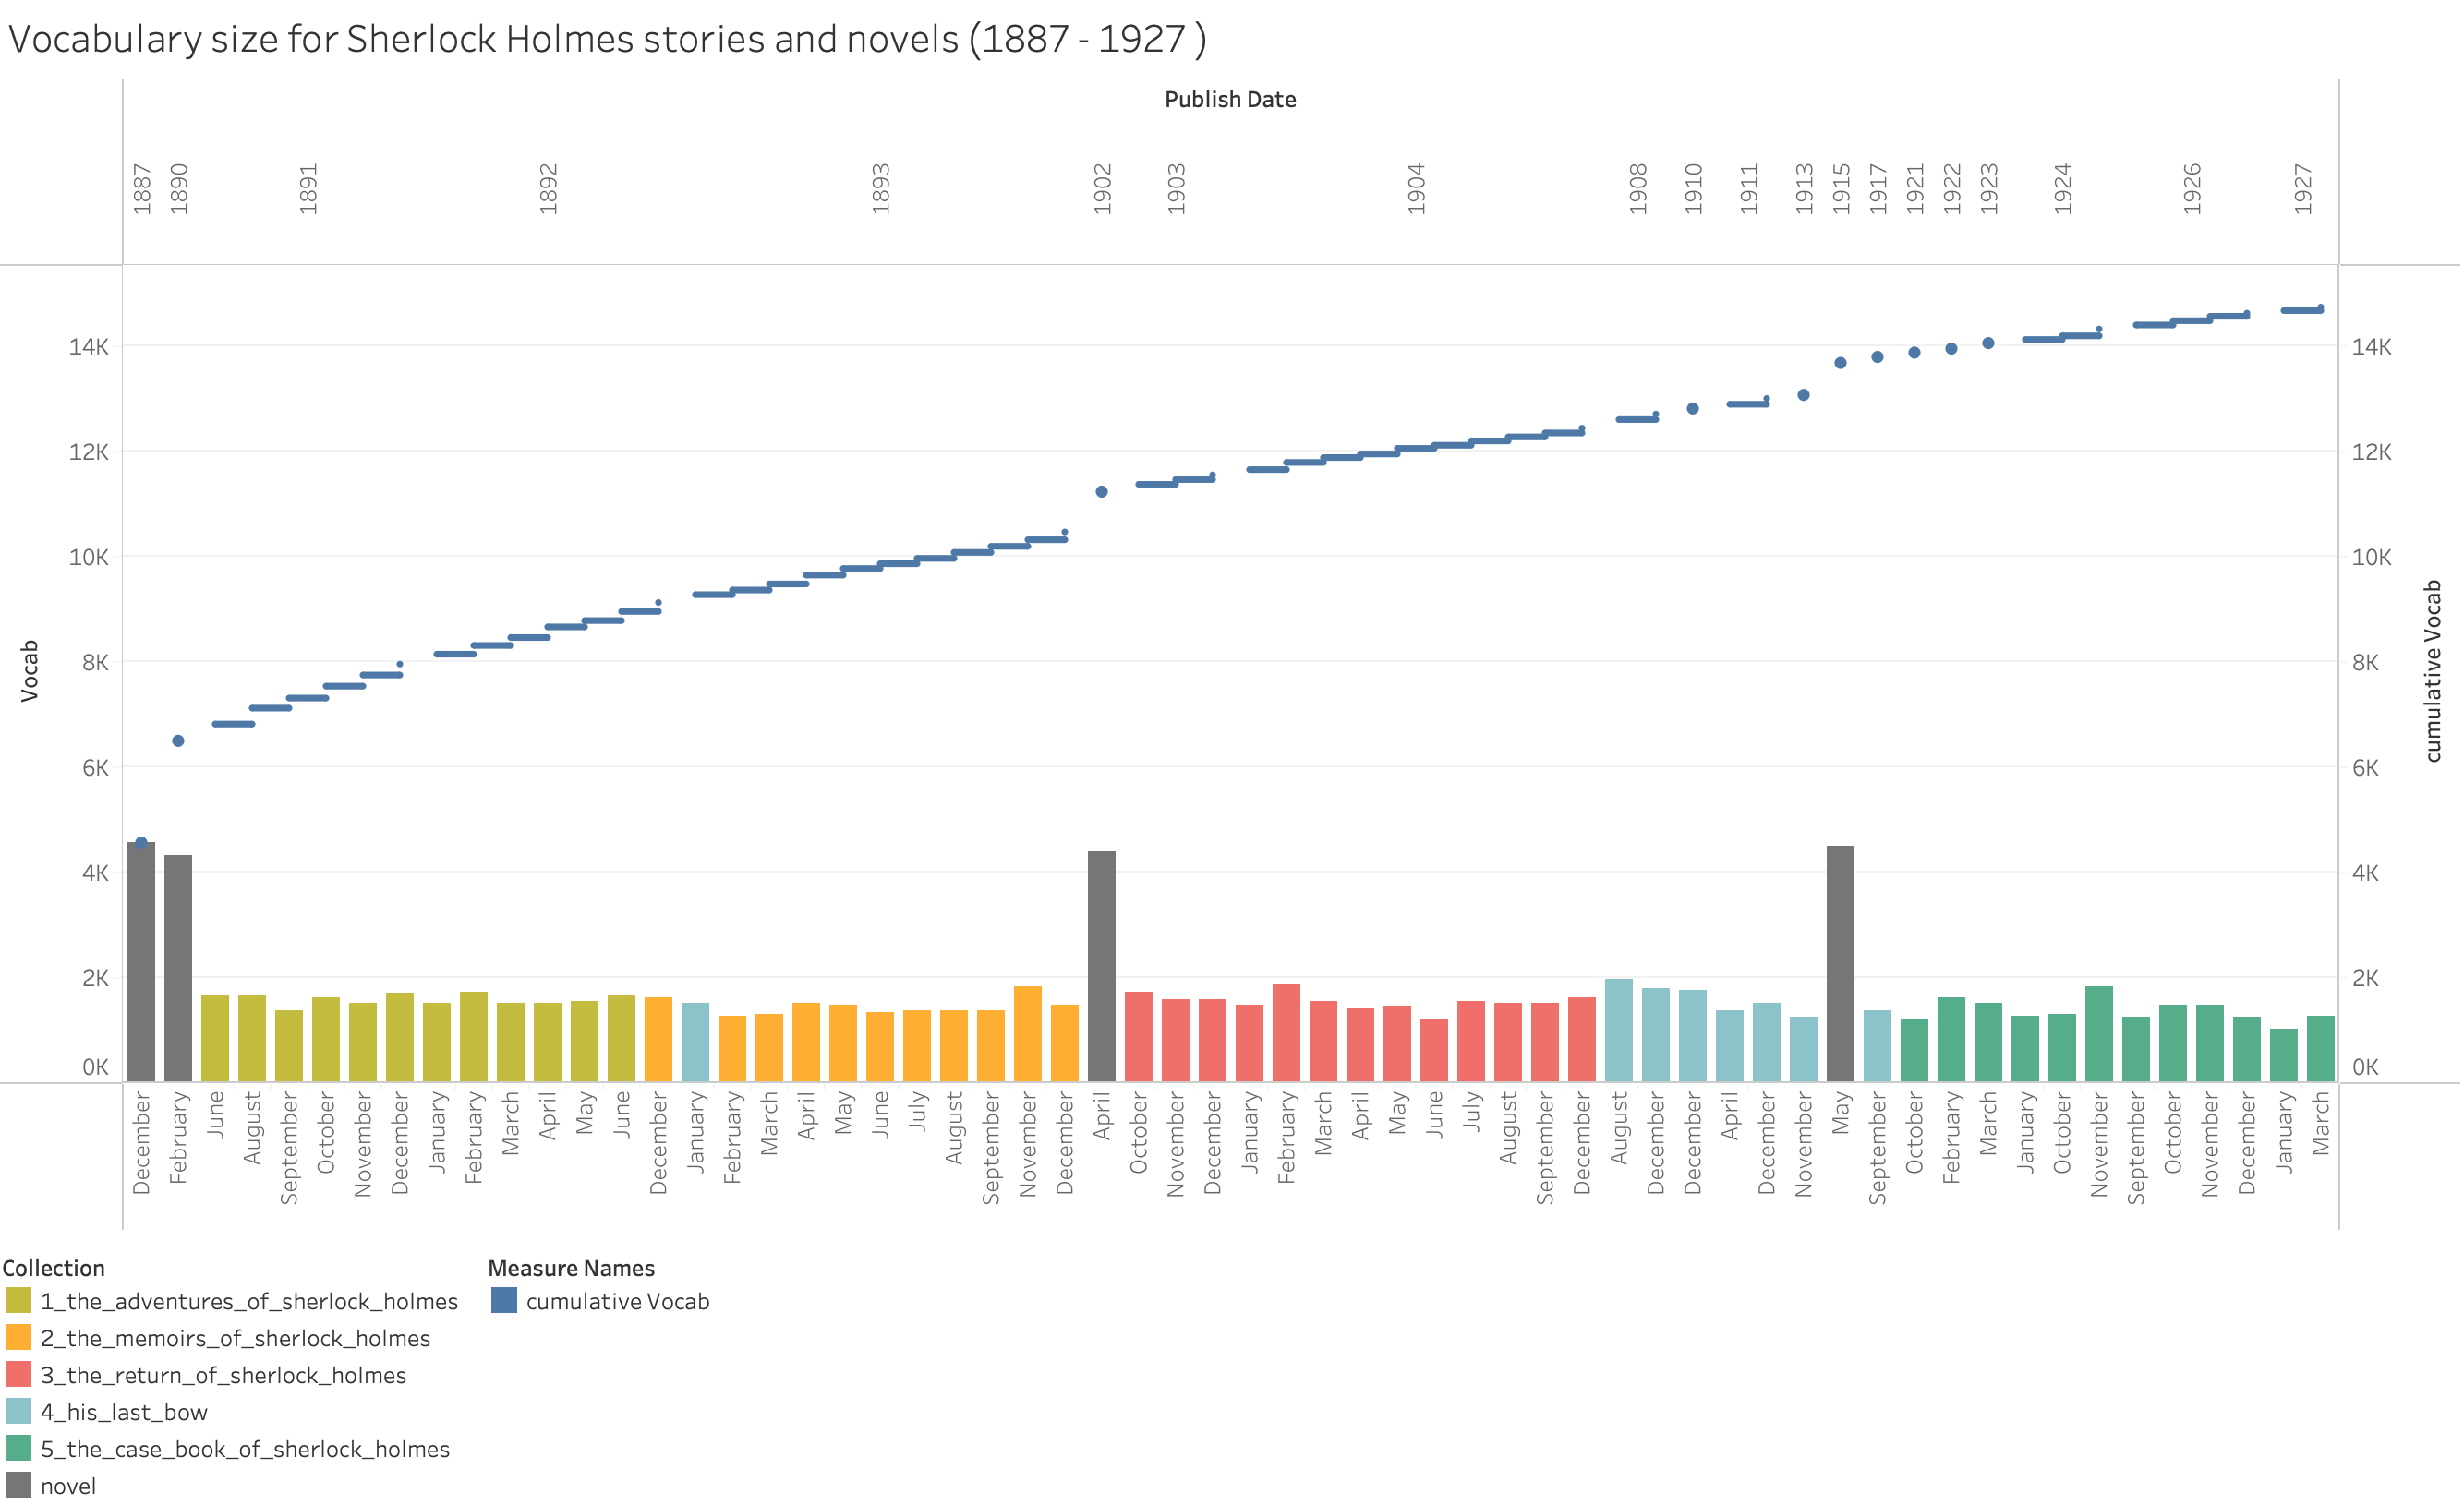
/3
For the visualization of the co-occurrences of the characters the tool we have chosen is Gephi. As input two files were given, one containing information about the nodes, one about the edges. We adjusted the sizes of the nodes based on their degree first and then on the betweenness centrality metric. The sizes of the edges were set according to their weights which is based on the closeness of the characters. Parallel with the size of the nodes and edges the color of them also changes from lighter to darker to make it more aesthetic visually. Network of John H. Watson based on the betweenness centrality measure in the co-occurrence network.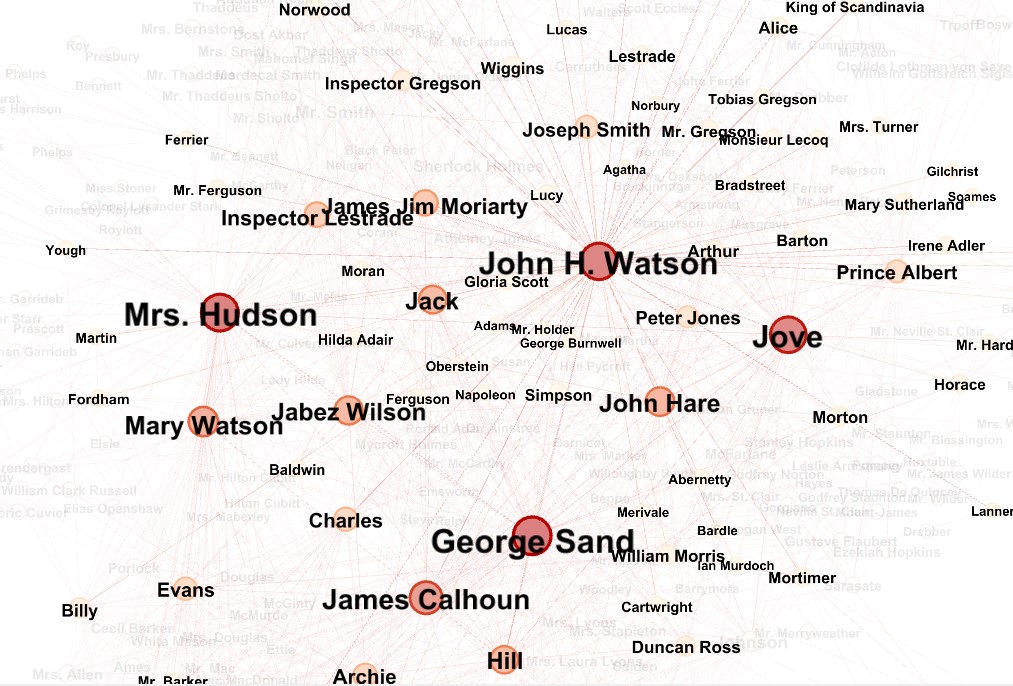
--
Image by bluebudgie from Pixabay